The challenge of ranking Historically Black Colleges and Universities (HBCUs)
www.degreechoices.com is an advertising-supported site. Featured or trusted partner programs and all school search, finder, or match results are for schools that compensate us. This compensation does not influence our school rankings, resource guides, or other editorially-independent information published on this site.
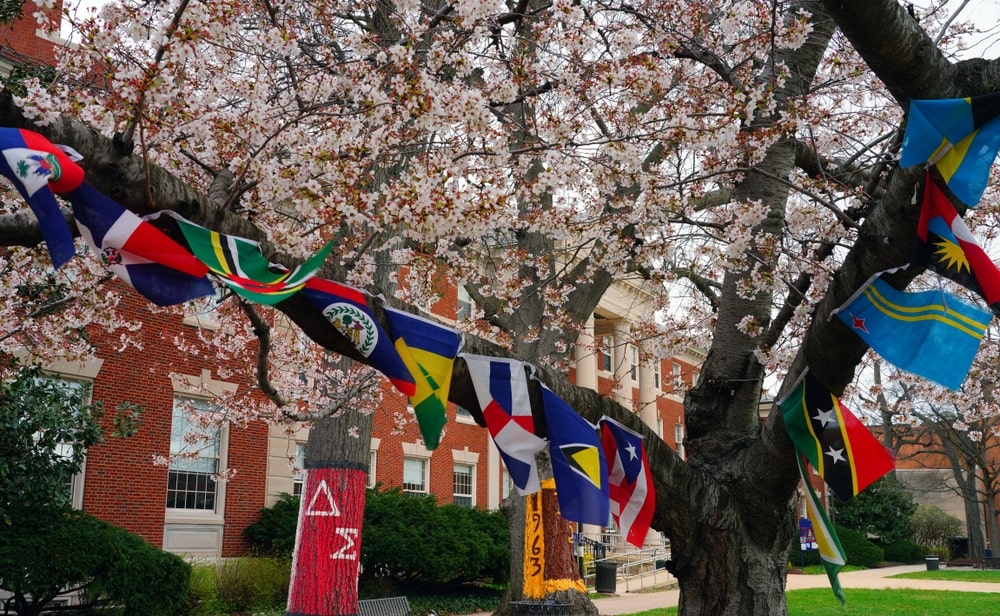
The first HBCU, Cheyney University of Pennsylvania, was established in 1837. Between 1865 and 1870, an additional 26 HBCUs had opened. By the 1930s, there were 121. Today there are 101 HBCUs across 19 states, concentrated in the southeastern United States.
Dr. Harry L. Williams, Thurgood Marshall College Fund President, describes HBCUs as uniquely mission-driven, marked by a “high-touch approach” and a “culture of caring”.
What are HBCUs?
Title III of the Higher Education Act of 1965 defines an HBCU as any accredited historically Black college or university established prior to 1964, with the principal mission of educating Black Americans.
Popular online programs
www.degreechoices.com is an advertising-supported site. Featured or trusted partner programs and all school search, finder, or match results are for schools that compensate us. This compensation does not influence our school rankings, resource guides, or other editorially-independent information published on this site.
The top 5 HBCUs in the country perform well on many of our college ranking metrics, but HBCUs on the whole underperform in terms of student economic outcomes. Unsurprising, considering that Black college graduates earn on average 21% less than their white counterparts.
However, studies have found that Black students at HBCUs feel significantly more supported and mentored than Black students at predominantly white institutions (PWIs) and are more likely to enter “higher-status” occupations. These are examples of important factors our rankings cannot quantify.
Our rankings pit HBCUs against institutions that have 89% fewer Black students; but they do not account for the effects of structural and institutional racism, the racial wealth gap, and the challenges faced by Black Americans on the job market.
Challenges to measuring the economic outcomes of HBCUs
A more meaningful evaluation of HBCU economic performance would isolate Black graduates of PWIs for comparison, but the inability to disaggregate federal earnings data by race makes this extremely difficult.
In February 2022, the House of Representatives passed the broadly popular College Transparency Act. Backed by more than 150 organizations, including the progressive think tank Third Way and the Bill & Melinda Gates Foundation’s Postsecondary Value Commission, the Act seeks to overturn the current ban on comprehensive student-level post-secondary data collection. It includes a call to disaggregate data by race, ethnicity, and gender. As of January 2023, the College Transparency Act has not yet been passed by Congress.
HBCUs in our analysis
We limit our focus to 68 HBCUs within the continental United States offering 4-year degrees. Specialist colleges and universities – i.e., law schools or theological institutions – are not considered in our analysis.
What makes HBCUs unique
While underperforming in terms of student economic outcomes, HBCUs overwhelmingly serve Black and low-income students – 2 demographics that generally earn less coming out of college.
- 81% of HBCU students are Black (compared to just over 10% at all other ranked schools)
- 59% of HBCU students receive Pell Grants (compared to 32% at all other ranked schools)
While we are unable to directly compare the economic performance of Black students from PWIs and HBCUs, we can attempt to narrow our focus to schools that more closely approximate HBCU income and race demographics.
How we compare value
We determine which university types offer the best investment to students using 2 metrics:
- Payback compares university cost to student earnings once they enter the workforce.
- EarningsPlus considers earning performance at each school without taking cost into account.
Payback and EarningsPlus combine into one economic score (ES); the lower the score, the better. We also tailor this specifically to lower-income student demographics with an Economic Mobility Score (EMS). When it comes to the EMS, the higher the score, the better.
For more detailed information, please visit our methodology page.
Pell Grants
All but 4 of the HBCUs we evaluated have student bodies composed of more than 40% Pell Grant recipients.
Narrowing our PWI focus to match this 40% threshold changes the aggregate Pell grant recipient rate from 33% to 50%, still lower than the HBCU figure of 60%, but in the same ballpark. While PWI earnings are still better than those of HBCUs, PWIs underperform substantially in terms of payback and economic score.
| Cost | Earnings | Payback | Economic score | |
| 40%+ Pell | $87,903 | $43,231 | 7.62 | 8.70 |
| HBCU | $79,365 | $37,693 | 6.34 | 7.70 |
HBCUs overperform greatly on economic mobility – with an average score of 13.86 compared to 6.0 – and the graduation gap narrows to 11%, from 56% to 44%.
If we narrow the focus even further, considering only PWIs with a greater than 50% Pell rate, the aggregate Pell percentage approximately equals the HBCU rate of 60%.
| Cost | Earnings | Payback | Economic score | |
| 50%+ Pell | $96,440 | $41,595 | 9.78 | 11.70 |
| HBCU | $79,365 | $37,693 | 6.34 | 7.70 |
In other words, when we consider the socioeconomic ecology of the student body, HBCUs outperform in terms of value for money, while continuing to underperform on earning metrics.
Percentage of Black students
Forty-five percent of the schools with 50%+ Pell rates are for-profit colleges. These schools also have the highest percentage of Black students outside of HBCUs, at just under 25% (compared to 9% at public and private non-profits). But for-profit schools are an entirely different animal – often online, and usually focused on non-traditional students like part-timers and non-first-time students. A good number are also “predatory” and have long been criticized for race-based marketing.
| Cost | Earnings | Payback | Economic score | |
| For-profit | $88,048 | $41,089 | 7.34 | 8.09 |
| HBCU | $79,365 | $37,693 | 6.34 | 7.70 |
Again, HBCUs overperform on value for money and economic mobility metrics. HBCUs also graduate a slightly higher percentage of students – 44% compared to 42%.
HBCUs and funding inequities
When ranking HBCUs according to earnings, the following 5 schools come out on top:
- Xavier University of Louisiana
- Hampton University (Virginia)
- Spelman College (Georgia)
- Morehouse College (Georgia)
- Bowie State University (Maryland)
While these elite HBCUs educate fewer Pell students than the average HBCU – 40% vs 59% – this figure is significantly higher than the average of 28% at all other private non-profits. In other words, these institutions’ earning performances are comparable to all other private non-profits in the country and the schools educate 47.5% more low-income and close to 8 times more Black students while operating with significantly fewer financial resources.
| Cost | Earnings | Payback | Economic score | |
| Top 5 HBCU | $155,407 | $53,861 | 5.30 | 5.52 |
| PWI private schools | $107,082 | $53,784 | 4.24 | 4.37 |
Total net tuition at the 5 top-performing HBCUs is, on average, $17,352 more than at non-HBCU private non-profits. For Pell students, net tuition is on average $20,852 more, with an average Pell discount of $14,676, compared to $18,176 at non-HBCU private non-profits. These higher costs explain why even the top HBCUs perform worse than similar PWIs, and why their economic mobility scores are not significantly better than average despite the schools educating so many more Pell students.
Private universities depend on two sources of income to fund operations – tuition and private donations. And when it comes to private donations, philanthropists are more likely to give money to predominantly white institutions.
- Between 2018 and 2019, endowments at HBCUs were 7 times smaller than at non-HBCUs.
- According to the Department of Education, 9 HBCUs have no endowments whatsoever.
- The top 10 best-funded PWIs have a combined endowment of $328.7 billion, led by Harvard University at $53.2 billion. The figure for the top 10 HBCUs is $2.7 billion, led by Howard at $806.4 million.
Public HBCUs rely on government funding much more heavily than their PWI counterparts (54% versus 38% of overall revenue), and yet federal funding cuts to education between 2003 and 2015 disproportionately affected HBCUs.
- Private HBCUs suffered the worst cuts of all higher education sectors, at 42%.
- Underfunding at HBCUs is a chronic and historically rooted issue. The 18 land grant HBCUs, like all land grant universities, are owed annual appropriations from state legislatures. For the past 3 decades, these schools have been owed 12.8 billion. In some states, including Maryland, Alabama, Mississippi, and Tennessee, this has led to excruciatingly long lawsuits over inequities in state funding.
- According to a 2021 analysis, HBCUs have about two-thirds the resources to spend per student compared to the average college.
- The same analysis found that HBCUs receive much less in tuition revenue than other schools. The average at non-HBCU public schools is $6,700 per student, and just $4,900 at public HBCUs; at private schools, the disparity is even greater – $17,000 at non-HBCUs compared to $10,400 at HBCUs.
- Federal research funding for HBCUs was 15% less in 2019 compared to 2001.
Despite these persistent funding inequities, HBCUs consistently achieve more with less. HBCUs, while representing just 3% of America’s colleges and universities, enroll 10% of all Black students and produce close to 20% of all Black college graduates.
HBCUs and the racial wage gap
An alternative way to evaluate the economic mobility provided by HBCUs is to focus on EarningsPlus scores. EarningsPlus compares student earnings against a weighted average benchmark based on their major and graduation year.
The racial wage gap in the U.S. across all levels of education is around 24% – meaning a Black worker in America earns, on average, $0.76 for every $1 earned by a white worker. (Recall that, for college graduates, earning disparity by race is around 21%).
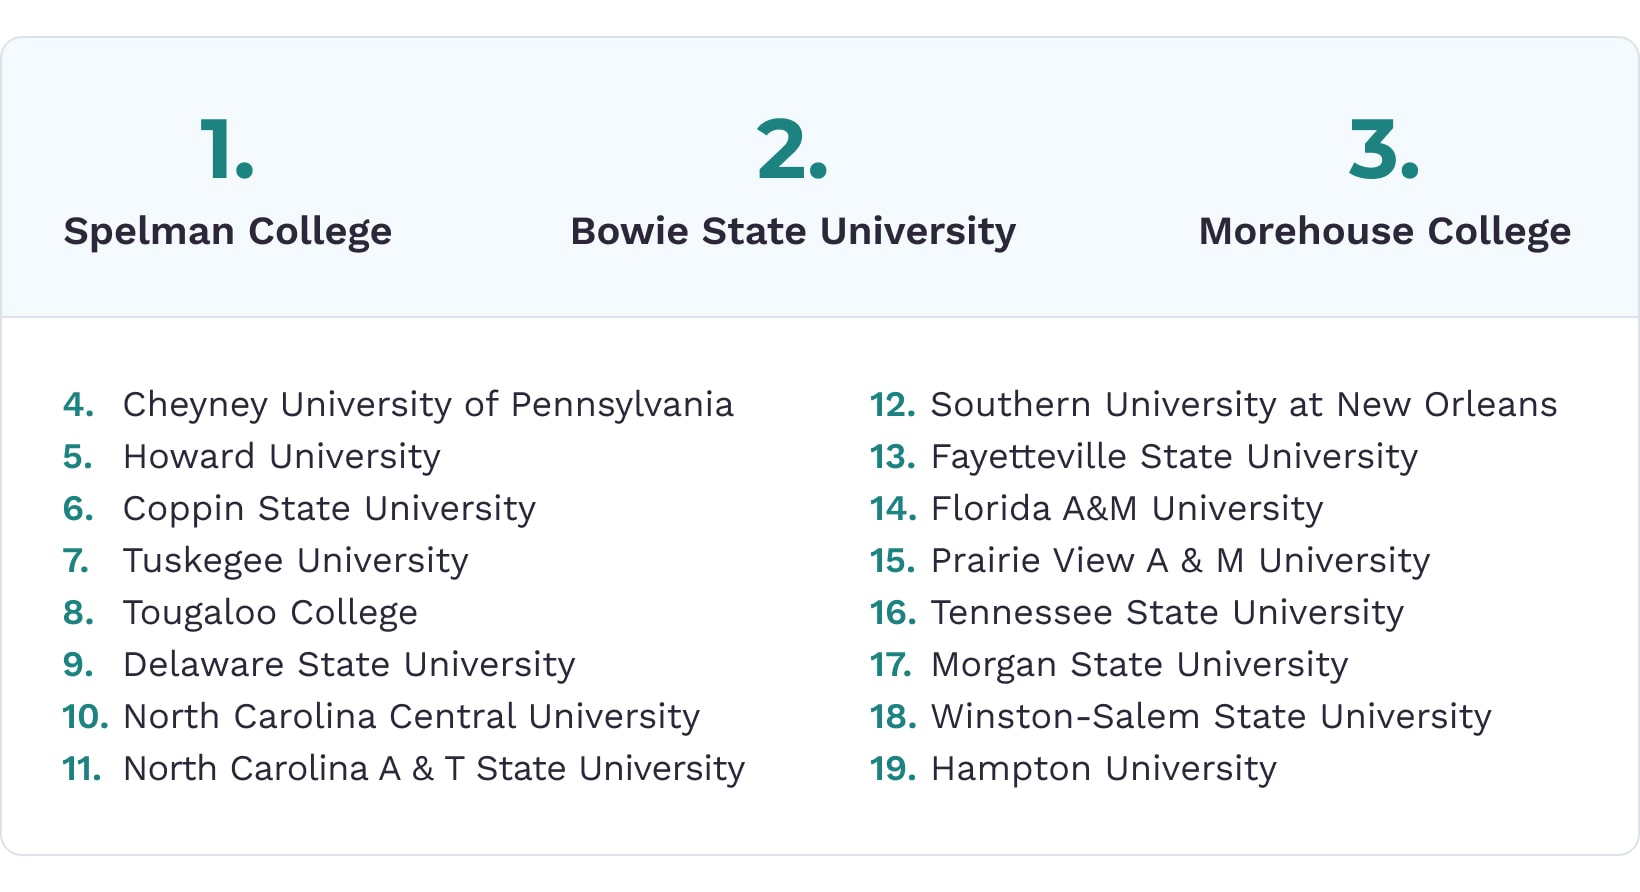
At the following 19 HBCUs, EarningsPlus is at least 90% the state average. For the top 3, EarningsPlus is above the state average. This means these HBCUs are closing the wage gap.
Final thoughts
HBCUs are anchor institutions for communities and hubs of Black excellence. Thurgood Marshall, the first Black Supreme Court justice, attended Lincoln University, an HBCU. He went on to Howard Law, where he began formulating the legal strategy that would lead to the striking down of school-segregation laws in the landmark Supreme Court decision known as Brown v. Board of Education.
Many celebrities have spoken publicly about their experiences at HBCUs. A common theme touched on by both celebrity and non-celebrity HBCU alumni has been the way attending an HBCU reinforced their sense of pride in Black culture and history. There are countless reasons why students choose to attend HBCUs, but immersion in Black culture is certainly key.
Limitations on the available data don’t permit a direct analysis of how well non-HBCUs serve Black students economically. At the same time, historical and chronic disadvantages continue to affect the economic outcomes of HBCUs. Yet despite these challenges, many HBCUs provide a substantial return on investment and economic mobility to their graduates, demonstrating that our school rankings alone don’t tell the whole HBCU story.
www.degreechoices.com is an advertising-supported site. Featured or trusted partner programs and all school search, finder, or match results are for schools that compensate us. This compensation does not influence our school rankings, resource guides, or other editorially-independent information published on this site.
Did you enjoy this post?
Related Articles
Continue with these related posts, or visit our blog for comprehensive guides on everything from choosing the right degree to mapping out a career path in your field.