How are colleges ranked? Our methodology


David Levy manages the product and data strategy for Degreechoices and writes about college rankings and accountability.
Brandes Gress assists the content team with the management of daily operational activities, ensures content is published on a timely and accurate basis, and works on content-related projects.
College is expensive. In 1980, the price to attend a 4-year college full time was $10,231 annually, including tuition, fees, room and board. Now, the cost of a 4-year degree is $22,306 a year. Private nonprofit colleges cost an average of $48,965 each year, so if you’re looking to get a 4-year degree, you’ll need to be smart with your money.
We developed our ranking system with a singular focus on relative financial value unlike other ranking systems, which rely heavily on subjective factors..
In this methodology statement, we’ll provide a detailed analysis of how we calculate our rankings.
Our undergraduate and graduate program-level rankings consider 2 economic metrics:
- The relationship between the cost of degree and a student’s eventual earnings;
- An earnings comparison between different schools.
Our data sources
Using only government-provided source material is, in our view, the best way to maintain objectivity and transparency. Our rankings system is based entirely on data provided by the U.S. Department of Education from 3 sources:
Integrated Postsecondary Education Data System (IPEDS)
IPEDS is a system of interrelated surveys conducted annually by the U.S. Department of Education’s National Center for Education Statistics (NCES).
Universities should report data to the government if they want to receive federal funding, and part of that is classifying the programs they offer. Instead of using the program’s full name, schools give it a Classification of Instructional Programs (CIP) code. This helps the US Department of Education track and report a program’s data.
We use CIP codes to classify and track programs in our database. We also use their data to create and calculate our rankings.
College Scorecard (CSC)
College Scorecard is an online tool created by the U.S. government to allow users to see cost, graduation rates, employment rate, and financial aid information on schools and their programs. We use this data to create and calculate our school-level and program-level rankings.
Census Bureau’s American Community Survey
Since the two sources above only provide college-level data, we use US Census Bureau survey data to get high school earnings. We use this to calculate high school earnings at the national and state level so we can compare it to college-level earnings.
Types of schools we analyze
We classify schools according to the Carnegie Classification of Institutions of Higher Education framework. When evaluating an entire institution, colleges and universities are divided into 4 main cohorts:
 National universities
Universities founded or managed by the government, but also may also operate autonomously without direct state control. They usually focus on research. For our rankings, they should also offer doctoral-level programs.
 Regional colleges and universities
Universities that serve a specific geographical region, typically within a state or province. They tend to have a more localized focus and often have a strong reputation in the region. They offer a wide range of undergraduate programs and some master’s programs, but few doctoral programs.
 Liberal arts colleges
Typically small, private institutions with a focus on undergraduate education. Liberal arts colleges provide students with a traditional liberal arts education, one that aims to impart students with extensive knowledge of the arts and sciences.
 Community colleges
Schools that offer 2-year associate degrees. If a college predominantly offers associate degrees with some 4-year programs, they are classified as community college. If the school offers a more even mix, they are classified as bachelor level and grouped in with regional colleges and universities. Like graduate schools, we only rank community colleges at the program level.
At the program level, we do not make a distinction between school types. If a school offers the relevant degree level and program, it is included in program-level rankings.
Graduation rates
If a school falls within the bottom 25% of national graduation rates, it will not qualify for ranking and will not be displayed. Although we do not incorporate graduation rates into our ranking calculations, the metric should be a crucial consideration for students. Graduation rates below the school’s state average are shown in red.
How we calculate undergraduate rankings
Earnings data
We know going to college is supposed to secure a higher paying job, but how can we tell which ones are worth it?
At the undergraduate level, we find out how much more students earn with a bachelor’s degree compared to those with only a high school education in their state.
We do this by subtracting the median earnings of a high-school graduate (as provided by Census data) from a college’s net median earnings (provided by College Scorecard/IPEDS).
The difference between those two numbers, or what we call marginal earnings, represents how much more someone would earn with that degree compared to if they only held a high school diploma.
A college’s net median earnings – high school median earnings = Marginal earnings
For example, in the case of Harvard University, we see that while a Harvard grad earns an average salary of $101,817 10 years after graduation, a high school graduate in Massachusetts (the state where Harvard is) earns an average salary of $42,196 annually.
So, we subtract $42,196 from $101,817. A degree from Harvard provides students with an average of $59,621 more annually than a high school grad in that same state; in other words, a degree from Harvard provides $59,621 in marginal earnings.
Note: When calculating earnings data at the university level, we use a school’s average earnings 10 years after enrollment, whereas at the program level, we use 4 years post-graduation earnings data. This is due to the nature of the data available on College Scorecard & IPEDS.
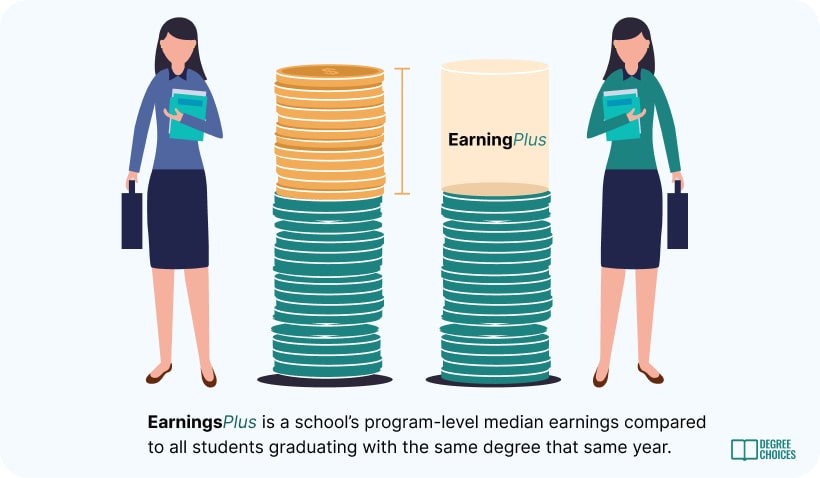
EarningsPlus
What if you want to calculate a specific degree’s earning potential rather than an entire school’s? If you know what degree you want to pursue, but don’t know which school is best for it, then EarningsPlus has got you covered.
EarningsPlus indicates a school’s program-level median earnings compared to all students nationwide graduating with the same degree in the same year. EarningsPlus is used for both undergraduate and graduate programs, using the relevant degree level.
To calculate EarningsPlus, we subtract the average salary 4 years post-graduation of holders of a certain degree in a state from the average salary 4 years after graduation from a certain university.
What if you’re not going to work in the same state you earned your degree from?
Students often attend college outside of their home state and return after graduation or move to another state entirely.
16.1% of Harvard students are from Massachusetts, while the rest come from out of the state. So, using in-state earnings data for our calculations doesn’t make sense.
To address this, earning calculations now come proportionally from in-state and out-of-state earning figures based on the student population. Because Harvard has a 16.1: 83.9 split of in-state and out-of-state students, the state-national earning benchmarks would have a 16.1: 83.9 split.
Let’s say we want to calculate the EarningsPlus of an economics degree from Harvard.
What we need for the calculation:
- The average salary of an economics degree holder from Harvard is $124,570.
- The average salary of all economics degree holders in Massachusetts is $85,726.
- The average salary of economics degree holders nationally is $72,055.
- 16.1% of Harvard students are from Massachusetts.
- 83.9% of Harvard students come from out of state.
To calculate the EarningsPlus of an economics degree from Harvard, we look at the proportion of students who are in state and out of state. In Harvard’s case, 16.1% are in-state students and 83.9% are from out of state. Then, we multiply those percentages by either national averages or state earning averages.
Our calculation would look like this:
Adjusted earnings = (% of in-state students X Massachusetts average earnings for economics) + (% of out-of-state students X Average salary for Economics majors nationally)
Adjusted Earnings = (0.16 * 85,726) + (0.84 * 72,055) = 13,799.2 + 60,456.4 = 74,255.6
So, seeing that the average economics graduate from Harvard earns $124,570 4 years after graduation, we’d subtract it from the number we just calculated above ($74,256 rounded up) and get an EarningsPlus of $50,314!
For further explanation of this process and what else changed, check out the full article here.
Annual net cost
Annual net cost refers to the cost of tuition, fees, books and supplies, housing, and other related expenses the average student pays after federal financial aid.
Total net cost
For undergraduate students, we calculate the total cost of a degree by multiplying the annual net cost by the average completion time (ACT).
ACT is the average of 4-, 6-, and 8-year graduation rates. Graduation time does not account for any differences in time to graduate based on choice of major, and students that do not graduate are not considered in the ACT calculation.
For graduate students we use (IPEDS-sourced) program-level debt data at the time of graduation as an indicator of relative cost.
Payback period
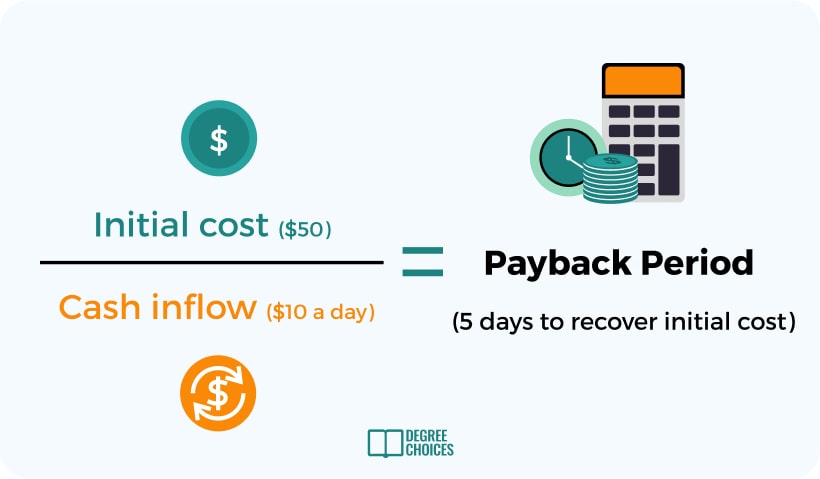
A payback period refers to the amount of time it takes to recover the cost of an investment. Basically, the payback period tells you how long it will take to get your money back from something you invested in.

For example, let’s say you want to start a lemonade stand: the initial investment is $50 for supplies, and you make $10 each day selling lemonade. To get the payback period, you divide the initial cost ($50) by the money you make each day ($10). In this case, it would take 5 days to earn back the $50 you spent. So, the payback period is 5 days.
For our calculations, the payback period is the time required to recoup the total cost of your education with your marginal earnings, or to reach the break-even point. Shorter payback periods are better because it means you get your money back sooner.
To find the payback period, total net cost is divided by the marginal earnings. The outcome represents how long it takes to pay back a college education with new earnings.
Total net cost ÷ marginal earnings = Payback period
For example, a bachelor’s in economics degree from Harvard has an annual net cost of $19,500, and the average completion time at this university is 4.266 years. If we multiply those numbers together, we get a total net cost of $83,182.
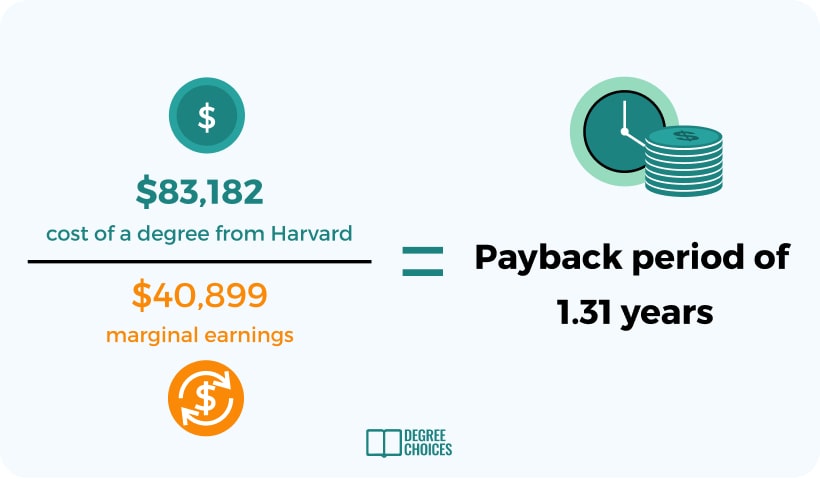
Then we divide the total cost ($83,182) by marginal earnings ($40,899) to get a payback period of 1.31. Meaning, hypothetically speaking, an economics degree from Harvard has a payback period of a year and four months.
Economic score
Drumroll, please. We have now come to the grand finale: the economic score, or the final number students see to help them gauge if a school is worth the investment or not.
The economic score adjusts a program’s cost-to-earnings metric (payback for undergraduates; debt-to-earnings for graduates) by their EarningsPlus performance.
Payback period ÷ EarningsPlus% = Economic Score
EarningsPlus, or how a school’s program compares earnings-wise to the same programs across the country, is converted into a percentage (EarningsPlus Percentage – EPP). By converting the EarningsPlus, originally a dollar amount, into a percentage, we can easily see how much better or worse a degree performs compared to the average of all degrees in the same field that same year.
EarningsPlus Percentage (EPP) in practice:
- An EPP of 100% would mean a graduate has the same average earnings as a high school graduate in that state;
- An EPP of 110% means a graduate has average earnings that are 10% higher than a high school graduates in that state.
- An EPP of 90% means a graduate’s average earnings are 10% lower than that of a high school graduate in that state.
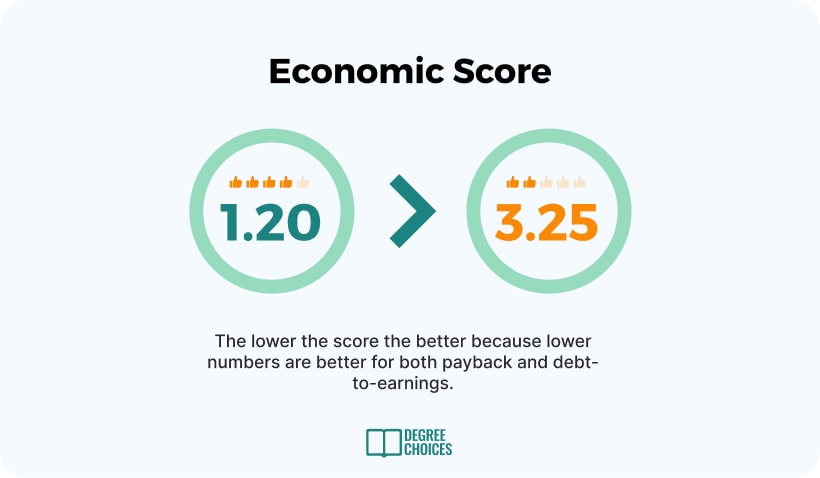
The lower the economic score the better because lower numbers are better for both payback and debt-to-earnings, so we felt it logical to keep the economic score on the same lower-is-better scale.
Back to our Harvard example. We know our payback period is 1.31 years, and our EarningsPlus is $49,969, so we need to convert the EarningPlus’ dollar amount to an EPP. To convert, we take our average salary of an economics grad from Harvard ($124,570) and divide it by the average salary of all economics degree holders ($72,055). The answer comes out to 1.61 after rounding, which is 161% when turned into an EPP.
This number means Harvard grads are earning 61% more than all other economics degree holders.
Cool, nearly done. Now we need to divide the Payback period (1.31) by the EPP (1.61), and we get an economic score of 0.81!
This calculation is what goes into all our school and undergraduate program level rankings.
How we rank universities
While we rank associate and graduate programs only at the program level, for the bachelor’s level we also evaluate the overall economic performance of each college or university.
Our institutional-level ranking methodology is the same as described above, but at the institutional level, we adjust each school’s EarningsPlus to account for the types of majors students are graduating with. (Why?)
In simpler terms, a school’s overall EarningsPlus performance is a sum of each program’s performance, each weighed according to its share of the school’s total student population.
How we calculate graduate rankings
How we calculate graduate rankings varies slightly compared to undergraduate rankings because of data constraints. At the undergraduate level, total net cost is provided; at the graduate level, only median graduation debt is available, so we use debt as an indicator of relative cost for graduate level rankings.
Graduate-level debt is how much debt the average graduate leaves with at the time of graduation which is calculated by IPEDS.
For graduate-level rankings, we first divide the median debt at graduation by student earnings 4 years after graduation to create a debt-to-earnings ratio. The debt-to-earnings ratio is applied to each program at each college or university with sufficient data.
Payback and the debt-to-earnings ratio are how we determine the “value” of a degree or program at each school. The lower these figures, the better, because the number represents the amount of time it takes for earnings to recoup the initial cost of your education.
To calculate the Economic score for graduate schools, we would take the program’s debt-to-earnings ratio and divide it by its EarningsPlus Percentage (EPP).
Let’s say you want to get a master’s in business administration (MBA) from Harvard.
This is the data we have on Harvard’s MBA program as reported by College Scorecard:
- Average salary of all MBA graduates nationwide – $82,456
- Average salary of someone with an MBA from Harvard – $107,513
- Average debt an MBA student from Harvard leaves with at the time of graduation – $20,525
With those figures we can now calculate the EarningsPlus, which is $25,057 (the average salary of an MBA from Harvard minus the average salary of all MBA grads). Once we have that, we turn that figure into an EarningsPlus Percentage (EPP) which is 1.30; in other words, they make 30% more than the national average of all MBA degree holders.
Now we calculate the debt-to-earnings ratio, or the relationship between the debt students leave with and how much they will be earning 4 years after graduation.
Harvard MBA students leave with an average of $20,525 in debt and earn $107,513. Therefore, the debt-to-earnings ratio is 0.20.
To calculate the economic score, we divide the debt-to-earnings ratio (0.19) by the EPP (1.30) to get a score of 0.15!
Helping students make the best choice
We rinse and repeat these calculations across thousands of schools and programs to help future students ease the financial burden of attending college. Getting a college degree is an investment – we rank universities and programs from an economic return standpoint to help students make the right one.
Determining which school or degree program is a worthy investment for you involves several factors, such as your personal interests, financial situation, long-term goals, and the earning potential of a degree.
Why don’t we rank doctorate programs?
While we know doctorate programs are the pinnacle of higher education, we do not currently rank them. Doctorate programs are structured differently than other degree levels and take varying amounts of time to complete, making their cost difficult to measure.
Also, students choose doctorate programs based on research faculty and opportunities, funding, the capstone project, and fellowship opportunities available.
Therefore, it’s difficult to calculate the return of investment of doctoral programs now.
FAQ
Why is my school not ranked?
There might be a number of reasons you don’t see your school on our site:
- Schools included in our rankings must be eligible for Title IV funds
- Schools with graduation rates in the bottom 25% nationally are pushed to the bottom of our ranking tables.
- Our rankings lists are divided into different school categories, and you might be looking under the wrong list.
- National Universities: Must offer doctorate level studies (Carnegie Classification 15-17)
Regional rankings: Masters and bachelor-level institutions that do not offer doctoral programs (Carnegie Classification 18-20,22) - Liberal Arts: Bachelor level colleges with an arts and sciences focus (Carnegie Classification 21)
Why can’t I find my school in my state’s rankings?
If there are fewer than 10 ranked schools, we do not display the state at the program or institutional level.
Why can’t I find my program listed?
If there are fewer than 10 ranked schools offering a particular program across the country, we do not show the program.
Why is my school not listed for the program I am enrolled in?
- We only consider programs with at least 10 conferrals at the undergraduate level and at least 5 conferrals at the graduate level.
- Programs with too few graduating students often will not have enough earning data for statistical significance, and so are omitted from Treasury reporting.
- We will not include schools that do not have the earnings and cost data required to calculate our economic score.
Why can’t I find my state for the program I want to study?
If there are fewer than 3 programs available for comparison in any state we will not populate the state rankings. You can still check out a school’s individual performance on their school profile.
Why can’t I find my school in the online college rankings?
- Only entirely online colleges are included in our best online colleges list.
- Colleges on the best online colleges list must have at least 5 different programs.
- Programs must have at least 10 graduates to be considered.
- Rankings for online programs include all programs with at least 10 graduates.
- These programs may be either hybrid or entirely online.
Does the data presented across the site come from the universities themselves?
No, Degreechoices.com is not associated with any university unless stated clearly as an ad. Earnings, costs, and other data points are taken from official government sources, which collect and process the data. Government sources we use include, but are not limited to, IPEDS, College Scorecard, O*net, and the Bureau of Labor Statistics.